Stability Part 2
In Part 1 I explained the origins of the rough and ready formula that people use to decide when it is time to reef. In this article I shall delve further into the subject of stability and begin by talking about the concept of a stability curve.
A stability curve is simply a graph showing righting forces against angle of heel and has nothing to do with sail area or wind strength. Such curves are relevant to all boats - multihulls, monohulls, fishing boats and cruise liners. 
The graph shows a typical curve while the sketch shows what righting moment (RM) really means as far as catamarans are concerned. The curve is taken from the yacht designers bible, Tony Marchaj's "Sailing Theory and Practice" and is used by many to "prove" that a catamaran is very unstable when compared to a monohull.
But what does such a curve really mean? Quite simply, imagine that you have a stationary catamaran floating in still water with no sails set. Then the height of the curve is equivalent to the load on a crane when it has lifted one hull up to a specific angle. Obviously not very realistic when compared to a boat sailing in wind and waves, but one thing it does show the importance of the position of the centre of gravity. The lower it is the better, as it results in a more stable boat.
(So as an aside, a ketch rig is not necessarily a good idea, for a 12m mast weighing 100Kgs decreases stability nearly twice as much as the roof of a bridge deck cabin 2m above the deck. In other words, an open deck ketch rigged cat is not necessarily more stable than a sloop rigged high bridgedeck cabin boat.)
Finally, irrespective of cabin size it is unlikely that the centre of gravity of any cat will be below the bridge deck floor, in fact a rough position is gunwale height.
The other point the curve illustrates is that the point of maximum stability occurs when the catamaran is just flying a hull, and by implication, stability will be increasing until that point is reached.
So these two ideas, first that heeling moments must be balanced by the righting moments (as explained in the first article) and second that all boats have a stability curve form the basis of all work on stability.
But we can go further: You have seen Hobie cats flying a hull for miles at a time, but probably never dared fly a hull on your cruiser. I've sailed my Quattro 16 in 30 knots of wind with full sail, yet it is only 8 feet wide, weighs under 300lbs, and has more sail than a Strider Club. So we know from practical experience that a cruising multihull must behave differently from a beach cat, even though the equations I've just explained would imply that they both behave the same.
So forget what it says in the books! There's more to it than that.
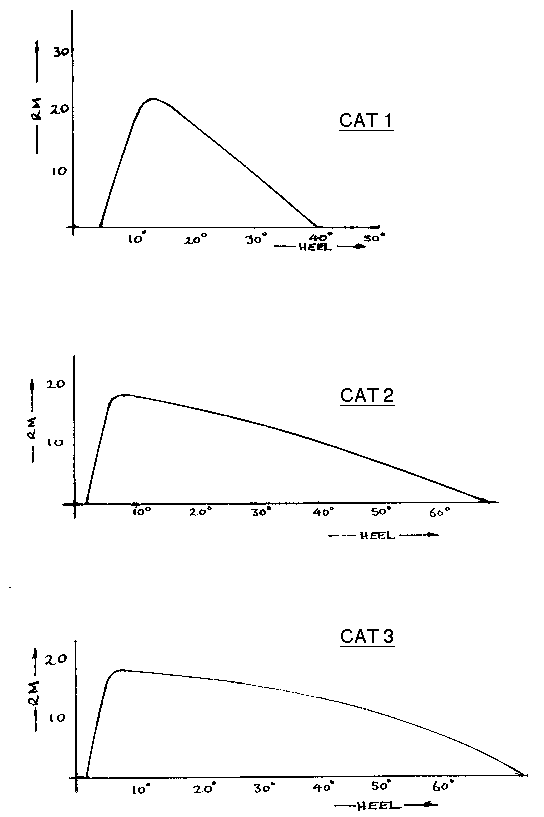
I'm not going to explain the theory, nor frighten you with equations, instead I'll just show you the graphs for three different types of catamaran when the stability curve is drawn, not as if the boat was being lifted by a crane, but rather when being heeled by the wind (in this case a steady 20 knots). Now, at first glance they may look the same as the standard catamaran graph I've just shown you, indeed they even look similar to each other, but in fact they are all subtly different. For a start, they don't begin at zero, for all boats heel slightly when sailing.

Cat 1 is a conventional narrow cruising catamaran like an Iroquois or Gemini. It has a very high peak curve. At 20 knots of wind it is at it's most stable as it is just flying a hull and heeled about 12 degrees. After that the curve drops away sharply, so any extra increase in heeling forces will cause a big increase in the angle of heel.
Cat 2 is a large wide light racing boat like a Micromultihull or F40, while Cat 3 is a Hobie cat.
Clearly Cat 2 is a compromise between 1 and 3.
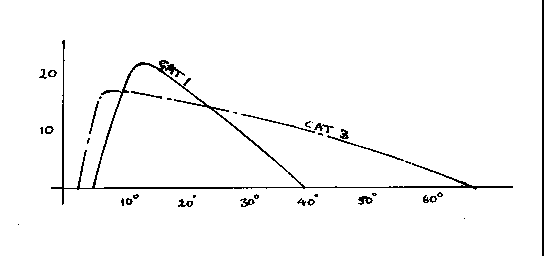
The Cat 3 curve shows why you can sail a Hobie on one hull for long periods, as between 25 and 50 degrees the curve is almost flat. This means that although the Hobie might heel further over in a gust it does not lose much stability, unlike Cat 1. 
These curves are not often seen, but I hope they demonstrate that it is possible to show theoretically that different types of catamarans behave differently, and - more important - that it is possible to predict quite accurately what happens in reality. In the graph above, I've superimposed the Cat 1 and Cat 2 curves so that you get a better idea of the differences. The relative flatness of the Cat 3 curve is obvious.
Of course, these curves are still only valid in flat water. Sailing in waves produces two effects, both detrimental to stability. The first is obvious. The waves heel a boat and this extra heel must be added to the heel from the wind. In a steep beam sea the wave angle might be 20 degrees or more. The second effect is more subtle, for although a hull may be firmly in the water when on the crest of a wave in actual fact the water movement in the wave results in a distinct loss of stability. An analogy might be the feeling of weightlessness when a lift starts to descend, or when at the limits of a child's swing. Adding these two effects together results in a significant loss of stability and help explain why a catamaran can capsize on a wave when moments before the crew were sailing along unconcerned.
In other words, instead of taking 10-12 degrees as the maximum likely heel (an angle at when most boats are at their most stable) 30 degrees would be a more realistic figure. This paints a very different picture, for at 30 degrees heel and in 30 knots of wind Cat 1 has very little reserve stability left.
That's enough for now! In part 3 I'll explain what happens when waves move up and down, and the wind gusts.


